

Pillar 2
Living the
Connected Home
Digitalisation is shaping the future of Europe and of its citizens. The number of smart homes is constantly growing and consumers recognise both an advantage in using connected appliances and a potential for making their lives easier. 31 million Europeans will be using smart appliances in 2024.


Statistical Report – 2019-2020

Source: IHS, Forbes


In billions
75 Billion
5x more Global Connected
Devices in 2025
Internet of things - connected devices installed globally, from 2015-2025


In the fourth quarter of 2019, 55.9 million smart speakers were shipped worldwide confirming an important increase in the demand for this type of device. Smart speakers with an integrated virtual assistance can carry out tasks based on users’ voice command and provide control over smart home functions.
Source: Statista

In millions
Others
Harman Kardon/JBL
Amazon
Alibaba
Xiaomi
Apple
JD.com
Sonos
Baidu


Shipments of smart speaker with intelligent personal assistant worldwide, from 2016 to 2019


Sales value of service robots for domestic use worldwide
from 2018 to 2023
In billion U.S. dollars
Source: Eurostat


Source: Eurostat


Energy consumption in households, for the main energy products,
in Europe, in 2018
64,1%
Space heating
14,8%
Water heating
14,4%
Lighting and appliances
5,6%
Cooking
0,3%
Space cooling


Appeal of Smart Home products categories, in 2019, in 7 markets (Brazil, Chine, Germany, Japan, South Korea, UK and USA).
Source: GfK


Find the product category “very appealing”
Would pay more for relevant category benefits
Appeal of Smart Home products, in 2019
Smart security
Smart health monitor
Smart entertainment
Smart appliances
Smart energy


Source: Statista


72,1 Million
2024
2017
18 Million
Total number of Smart Homes, in Europe


Source: Statista

3,16 Billion
Revenue in 2024
In billions
Revenue from Energy Management in the Smart Home, in Europe


19,8%
Average annual
growth rate
23,7%
Average annual
growth rate
-3%
Average annual
growth rate
Users of smart appliances in Europe
in million users
Average revenue
per user, in Europe
in million euros


Revenue of smart appliances in Europe
in million euros


Smart appliances in Europe
7.406
31,3
4.200
14,6
289
237


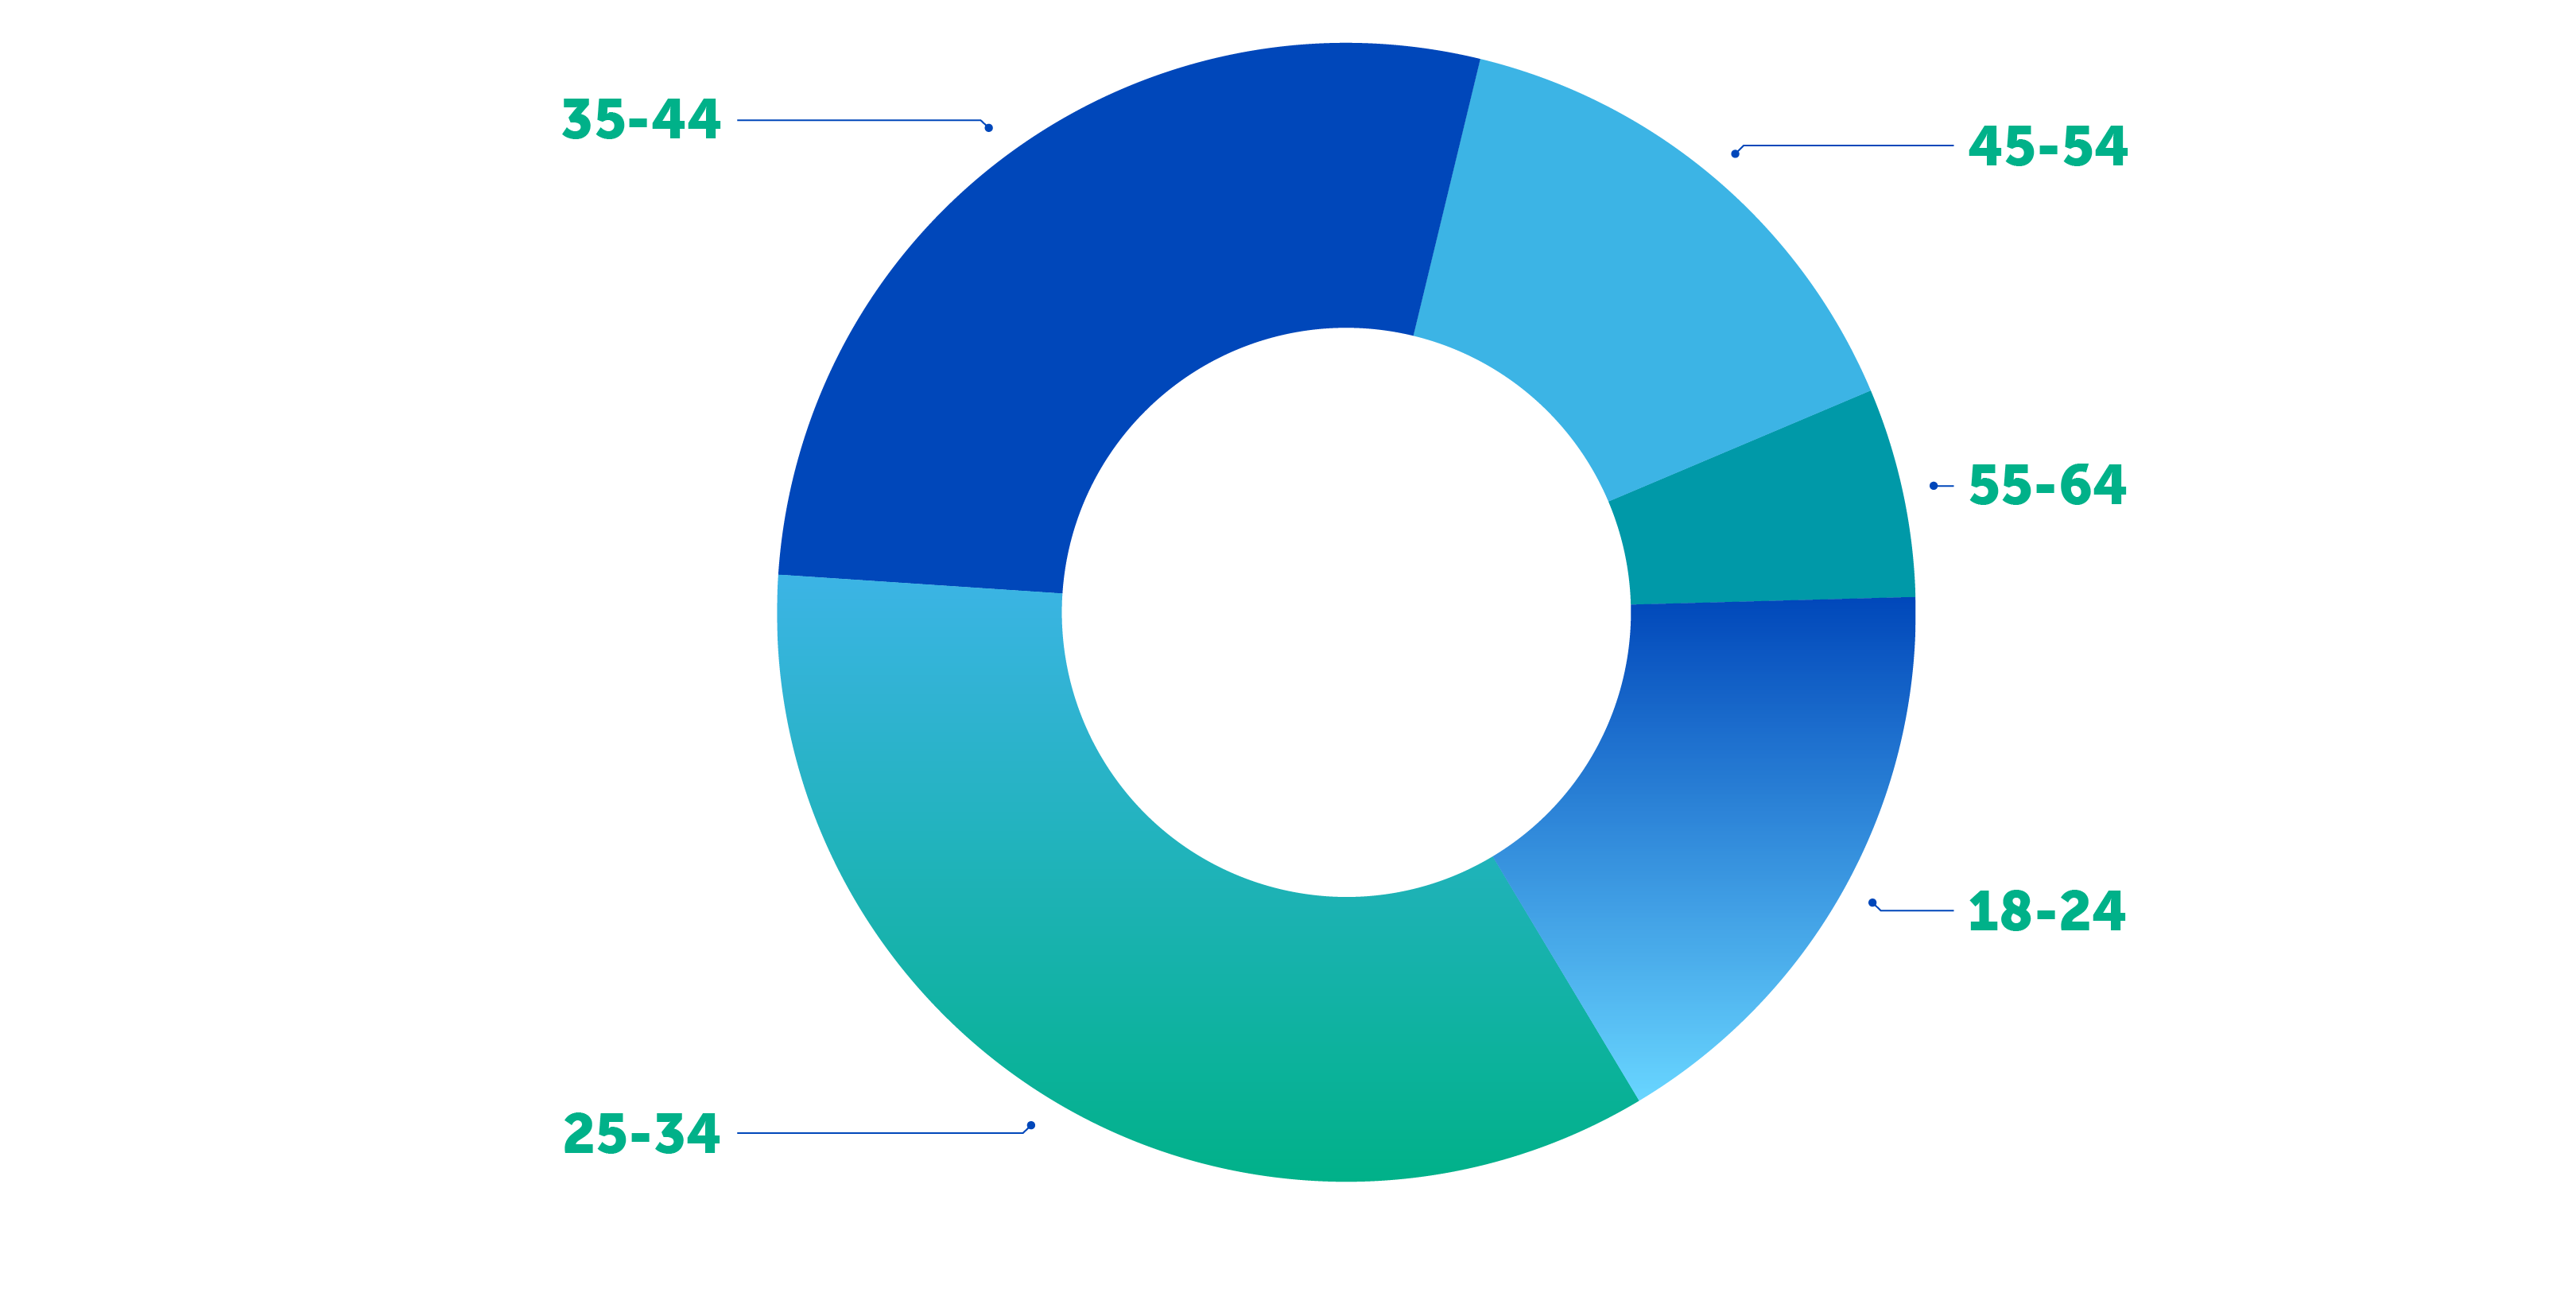
Considering the use of smart appliances, those between 25 and 44 years constitute the vast majority of the used in 2018 with 63%. On the other side, only 17% of the 18-24 years and 15% of the 45-64 years are using smart appliances in 2018.
Source: Statista

Users of smart appliances by age
28%
35%
17%
6%
15%


Source: Statista

Revenue of smart appliances in Europe

2018
2020
2022
2019
2021
2023
2024
In euros

Belgium
Netherlands
Ireland
France
Luxembourg
Estonia
Latvia
Russia
Lithuania
Finland
Denmark
UK
Norway
Sweden
Bulgaria
Greece
Turkey
Czech Rep.
Slovakia
Poland
Croatia
Slovenia
Serbia
Italy
Switzerland
Portugal
Spain
Romania
Hungary
Austria
Germany


0-1%
1-2%
2-5%
5-10%
10-20%
>20%

Source: Clarivate Analytics Derwent Innovation


Patents filed with European Patents
Office
EP/WO patent applications
filed in total
Patents granted
by European Patents Office
EP patent granted in total

Patents filed and granted with European Patents Office

Source: Eurostat, R&D related to the business sector

Total:
€ 204.142 Million
Research & Development expenditure by EU countries, in 2019


Source: Eurostat, R&D related to the business sector


%

+13%
EU28 R&D expenditure growth

Research and Development expenditure growth by EU countries,
in 2016-2019